Logic+ Analytics #
Use the Analytics menu to access all the reports available to analyse your schedules.
➡️ Navigation: Analytics
💡Check the selected schedules before you start on the List of Schedules tab.
💡Additional analytics are available that relate to Delay Analysis.
Concurrent Task Bow Wave #
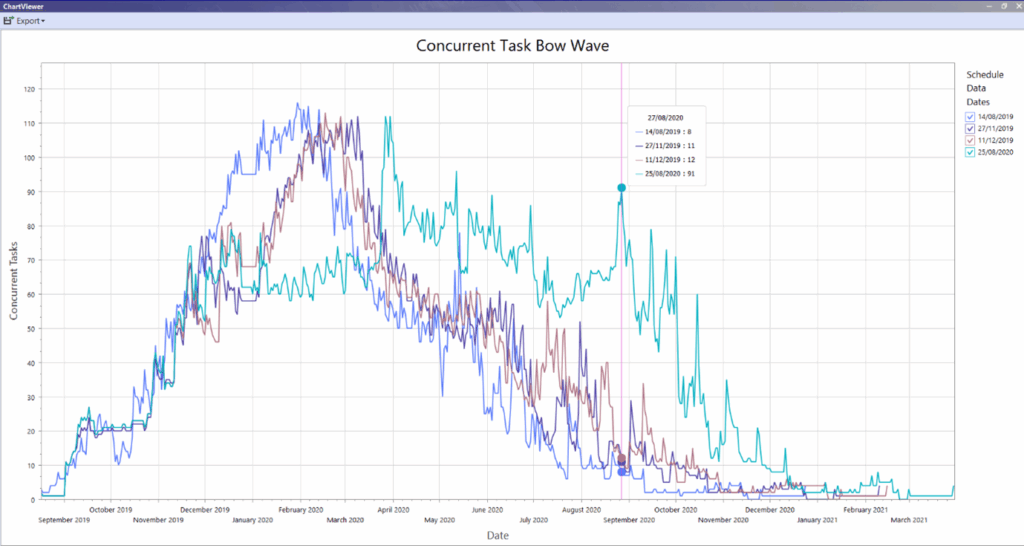
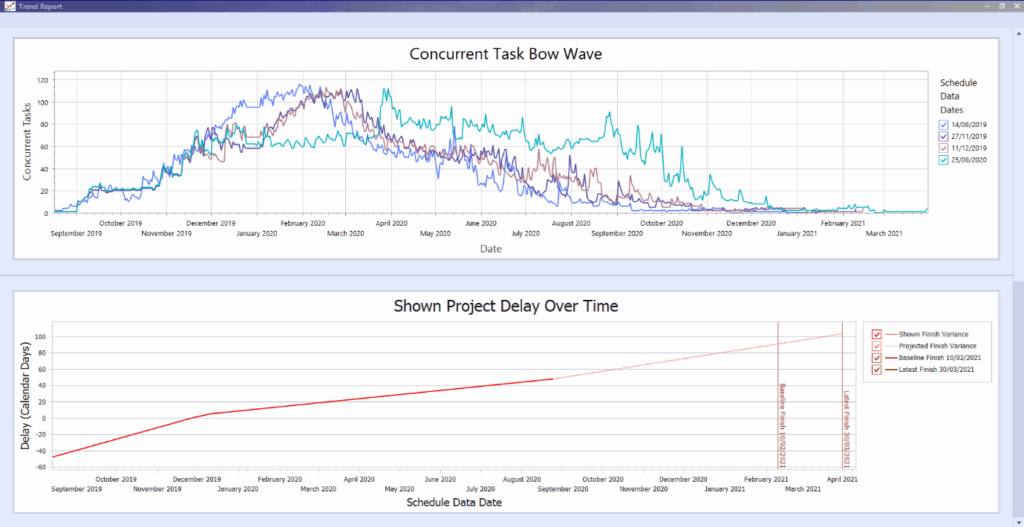
Concurrent Task Bow Wave Report analyses the number of activities planned for completion each month across different schedule files. It visualizes these activities throughout the program, highlighting peak production periods and the evolution of the plan from the baseline. This report can identify trends of increasing concurrent tasks over time, indicating a potential need for more resources to manage these activities and meet the schedule. If a project is resource-constrained, the report can also highlight potential delays in meeting the planned completion date.
Chart Details
Concurrent Task Bow Wave Report analyses the number of activities planned for completion each month across different schedule files. It visualizes these activities throughout the program, highlighting peak production periods and the evolution of the plan from the baseline. This report can identify trends of increasing concurrent tasks over time, indicating a potential need for more resources to manage these activities and meet the schedule. If a project is resource-constrained, the report can also highlight potential delays in meeting the planned completion date.
Concurrent Tasks: Show the total number of activities by date.
Schedule Data Dates: Shows the data dates for each schedule file included in the analysis. You can hide/unhide schedule file details as needed to help analyse the changes over time.
➡️ Navigation: Analytics > Bow Wave
Delay Trends #
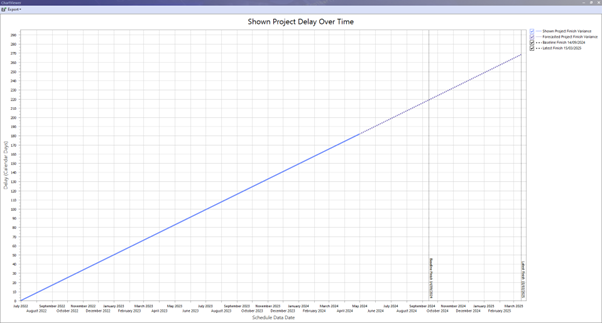
Project Delay Over Time report shows the difference between the baseline finish date and the actual finish date for each schedule file. Using the finish variance of the latest activity in each file, a forecast is created to predict the cumulative impact of these delays on the overall project timeline.
This report can be used as an indicator to determine if the planned finish date aligns with the forecasted finish date, considering the trends in reported delays.
Chart Details
Shown Project Finish Variance: For each schedule file in the project, the delay in calendar days (schedule file finish date – baseline schedule finish date) is displayed for the schedule files data date.
Forecasted Project Finish Variance: Displays a projection of the number of days delay up to the finish date from the latest schedule file.
Baseline Finish: Finish date from the baseline schedule file is displayed as a horizontal line.
Latest Finish: Finish date from the latest schedule file is displayed as a horizontal line.
➡️ Navigation: Analytics > Delay Trends
💡Use the checkboxes in the top right corner to hide/unhide chart details.
Float Trends #
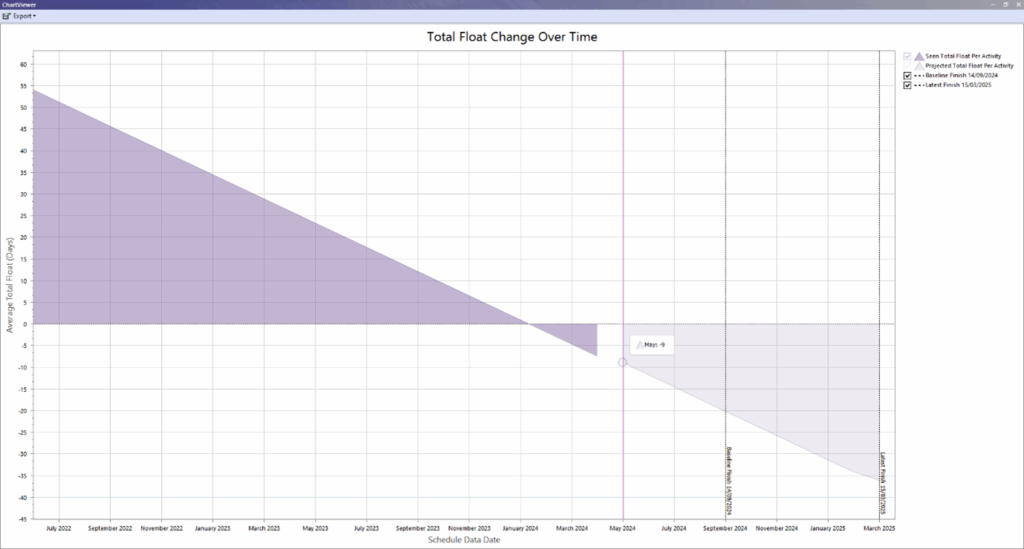
Total Float Change Over Time reports the total float per activity from all schedule files and calculates the projected float per activity up to the latest finish.
If this line crosses zero, this indicates float will go negative which suggests the target finish date may not be met.
Chart Details
Seen Total Float Per Activity: For each schedule file in the project, the average total float per activity in days (total schedule float/total activity count) is displayed for the schedule files data date.
Projected Total Float Per Activity: Displays a projection of the average total float per activity up to the finish date from the latest schedule file.
Baseline Finish: Finish date from the baseline schedule file is displayed as a horizontal line.
Latest Finish: Finish date from the latest schedule file is displayed as a horizontal line.
➡️ Navigation: Analytics > Total Float Trends
💡Use the checkboxes in the top right corner to hide/unhide chart details.
Duration Forecast Accuracy #
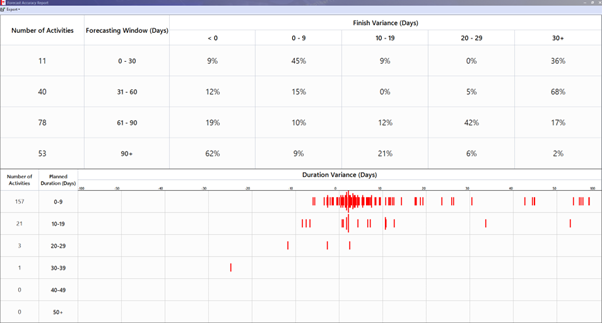
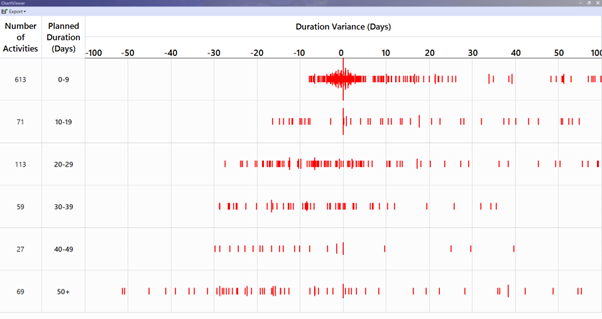
Duration Forecast Accuracy report displays the accuracy of the forecast or originally planned durations for all projects activities. The chart calculates and displays variances between the planned durations from the baseline schedule with the actual durations from the latest schedule file.
For example, this chart shows that for activities that had a planned duration of 0-9, there was a high number of activities that had an actual duration that was different to the planned duration by ~+1 day.
Chart Details
Planned Duration (Days): Activities are grouped into ranges of 0-9, 10-19, 20-29, 30-39, 40-49, and 50+ days based on their planned durations.
Number of Activities: This shows the total number of activities whose planned durations (baseline finish – baseline start) fall within each Planned Duration (Days) range.
Duration Variance (Days): The duration variance in days is calculated as the difference between the actual duration (actual finish – actual start) and the planned duration (baseline finish – baseline start) and displayed as a range from -100 to 100 days. The number of activities for each duration variance in days is displayed on a logarithmic scale, which means the data is grouped in intervals that increase by a consistent factor (such as 10). This grouping is based on the range of days planned for each activity’s duration.
➡️ Navigation: Analytics > Duration Forecast Accuracy
Finish Forecast Accuracy #
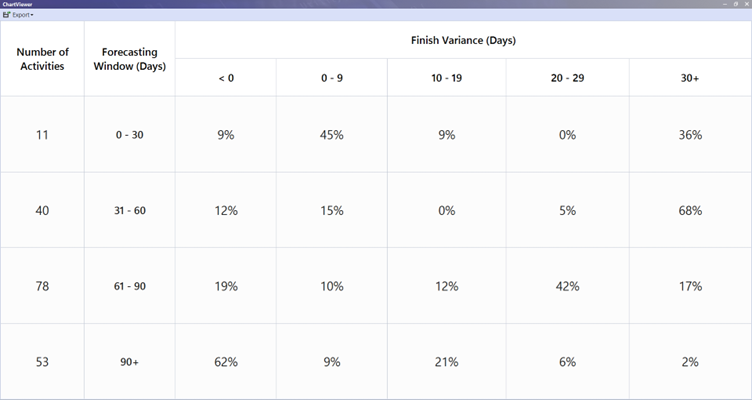
Finish Forecast Accuracy report evaluates the accuracy of forecasted or planned finish dates for all project activities. It calculates and displays variances between the actual finish dates from the latest schedule file and the planned finish dates from the baseline schedule file. By analysing the number of days activities were planned to finish after the baseline data date, the report shows the probability of activities finishing on time or being delayed (e.g., within the next 30 days). Generally, as the planned finish date extends further into the future, the variance is likely to increase.
For example, this chart shows that for activities that are forecast to finish between 31-60 days after the current baseline data date, that 68% of activities (27 activities of the total 40 within that range) finished 30 days later than the baseline finish date.
Chart Details
Forecasting Window (Days): Based on each activities planned finish date from the baseline file data date, activities are grouped into ranges of 0-30, 31-60, 61-90 and 90+ days.
Number of Activities: This shows the total number of activities whose forecast finish date (planned finish date – baseline data date) fall within each Forecasting Window (Days) range.
Finish Variance (Days): The finish variance in days is calculated as the difference between the actual finish date and the planned finish date and displayed within ranges of <0, 0-9, 10-19, 20-29 and 30+ days. The percentage of activities for each finish variance in days range is displayed as a percentage of the total activities forecasting window days range.
➡️ Navigation: Analytics > Finish Forecast Accuracy
Trend Report #
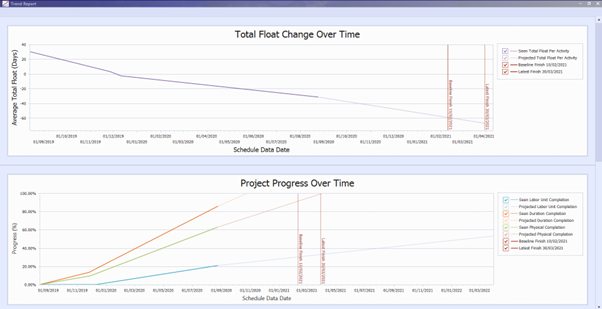
Trend Report combines the key trend reports into a single report to provide an overview of the status of a project.
Reports included:
- Total Float Change Over Time
- Project Progress Over Time
- Concurrent Task Bow Wave
- Shown Project Delay Over Time
➡️ Navigation: Analytics > Forecast Accuracy Report
💡Chart Export options only include Save as PDF and Save as Image. To Save as Excel run the individual report (Analytics > Total Float Trends, Progress Trends, Bow Wave, Delay Trends).
Forecast Accuracy Report #
Forecast Accuracy Report combines the Duration Forecast Accuracy and Finish Forecast Accuracy reports into a single report to provide a view of the accuracy of a project by showing the variances of the project activities forecasted duration and finish date.
➡️ Navigation: Analytics > Forecast Accuracy Report
💡Chart Export options only include Save as PDF and Save as Image. To Save as Excel run the individual report (Analytics > Duration Forecast Accuracy or Analytics > Finish Forecast Accuracy).