Traceback #
You run a traceback to generate the critical path for the baseline and schedule files selected.
A traceback works in reverse chronological order. Therefore, to start a traceback, select the activity with the latest date.
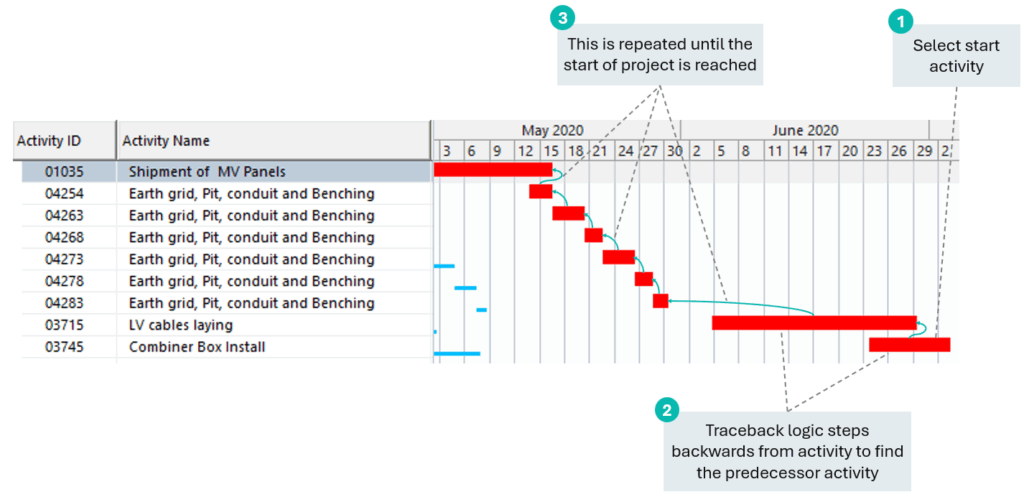
Start Traceback #
👉 Highlight the latest activity that you want to start the traceback from in the Schedule Viewer
👉 Select Start Traceback
There are two navigation options to Start Traceback:
➡️ Navigation: Top tab bar > Delay Analysis > Start Traceback
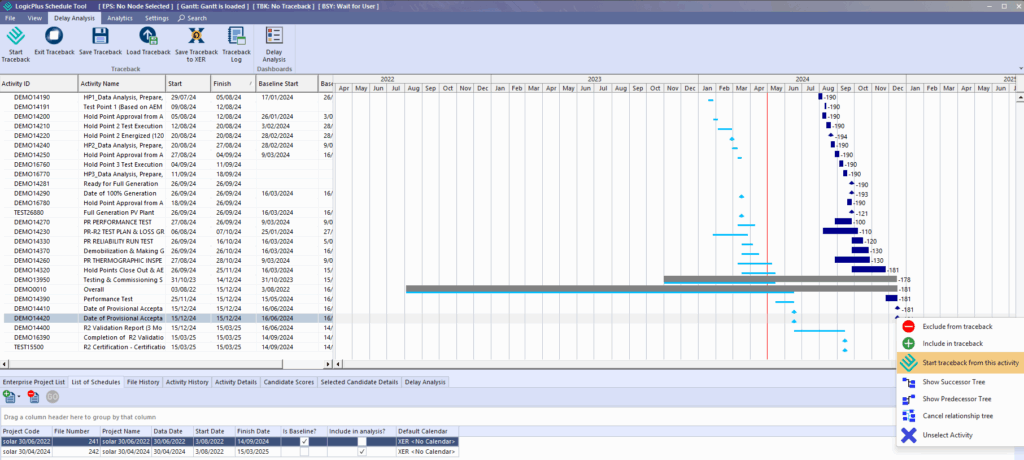
➡️ Navigation: Right click activity in Gantt view > Start traceback from this activity The traceback will start at the activity that is selected in the Gantt view. A grey highlight bar indicates which activity is currently selected.
💡Check the selected schedules before you start on the List of Schedules tab.
💡Remove WBS Grouping and sort by activity finish date to quickly find the last activity in the Schedule Viewer (see the View menu).
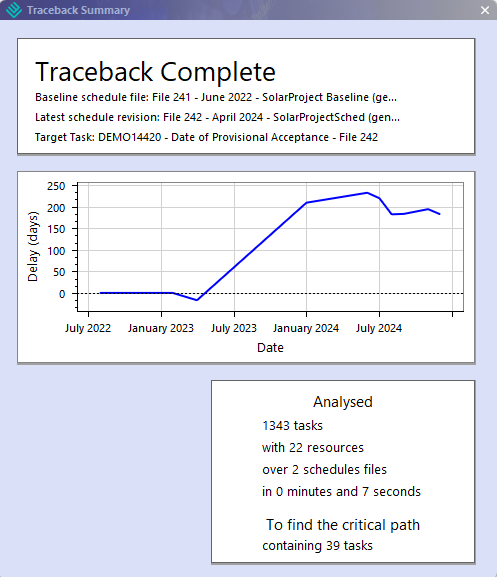
Traceback Summary
Traceback Summary is displayed after traceback completes which displays details about files analysed to determine critical path and summary details of analysis and the target task from which the traceback was run.
💡Delay Chart shown in the Traceback Summary is also shown in the bottom tab bar (Delay Charts)
Traceback Analysis #
After running a traceback, the Scheduler Viewer displays the baseline and critical path activities from the schedule file.
Key features that support traceback analysis include:
- Traceback Options
- Generate alternate critical path
- Candidate Scores
- Selected Candidate Details
- Delay Analysis Chart
- Delay Analysis Dashboard
Interacting with the gantt view, and the tabs on bottom tool bar will allow you to analyse activity details, see how the critical path was determined, generate alternate critical paths and review delay reports.
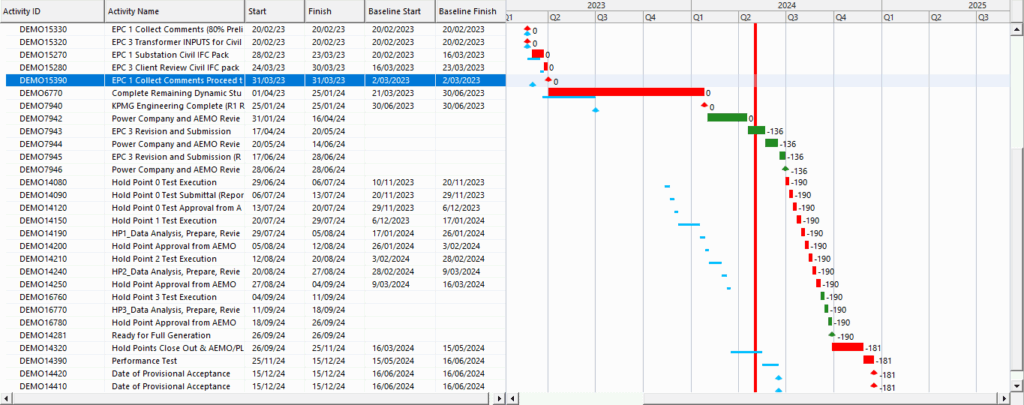
Traceback Gantt View
Critical path activities are shown in the Scheduler Viewer/gantt:
- Critical path activities that existing in the baseline are shown in red
- Critical path activites that have been added after the baseline are shown in green
- Baseline is represented by the light blue line
Traceback Options #
The following outlines additional traceback options.
➡️ Navigation: Right click in the Gantt view
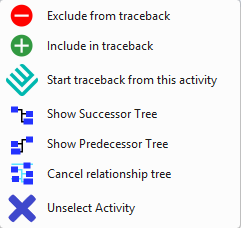
- Exclude from/Include in traceback: Excludes an activity from traceback. Excluded activities appear are highlighted as dark grey. Use the Include in traceback option to cancel the exclusion from the traceback.
- Start Traceback from this activity: Select to start a traceback. For detailed steps see section Delay Analysis > Running a Traceback.
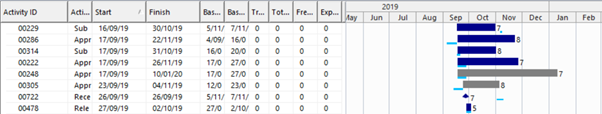
- Show Successor Tree: A successor tree is displayed showing all the tasks that depend on the completion of the selected activity.
- Show Predecessor Tree: A predecessor tree is displayed showing all the tasks that must be completed before the selected activity can begin.
- Cancel relationship tree: Cancels the display of the Successor or Predecessor Tree.
- Unselect Activity: Unselect activities while working in the Gantt view.
Generate alternate critical path #
After running a traceback, you may wish to analyse an alternate critical path based on an identified activity.
👉 In the Scheduler Viewer/gantt view, right click on the activity and select ‘Restart traceback from this activity‘.
Analyse different activity #
When analysing the traceback, the selected activity determines the details displayed in the bottom tab bar Candidate Scores and Selected Candidate Details.
To analyse a different activity on the critical path, you need to unselect the current activity and select a new one.
👉 In the Gantt view, left click on the activity or right click and select ‘Unselect Activity’.
💡Right click to ‘Unselect Activity’ is useful when working with large files and you can’t find the active activity for traceback analysis.
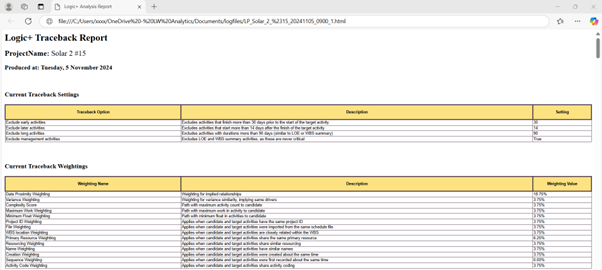
Traceback Log #
Displays the log of the current traceback. The log can be used to provide an audit trail of analysis.
The log includes:
- Current Traceback Settings
- Current Traceback Weightings
- Files loaded for analysis
- Activities excluded based on traceback settings
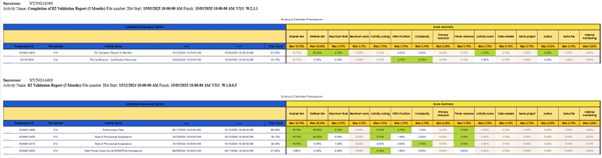
- Scoring of Candidate Predecessors
➡️ Navigation: Top tab bar > Delay Analysis > Traceback Log