Delay Analysis Chart #
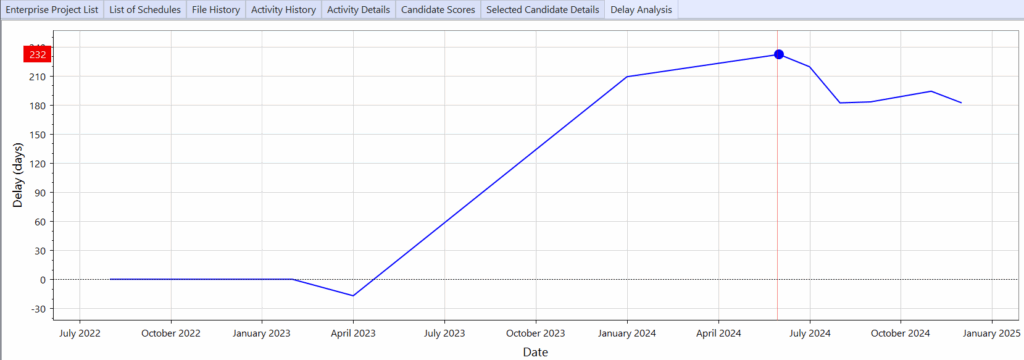
After running a traceback, a summary of cumulative time impacts is created and displayed in the Delay Analysis Chart.
The chart displays an interactive project timeline (x-axis) against cumulative delay impact (y-axis).
Use this summary view in conjunction with the activity details in the Delay Analysis Dashboard to understand the causes of time impacts on a project schedule.
➡️ Navigation: Bottom tab panel > Delay Analysis
👉 Mouse over key points will show the cumulative delay in days for a point in time.
💡 To use the Delay Analysis Chart, run a Traceback first.