Talk to an expert
Portal
Talk to an expert
  • Home
  • Products
    • Logic+ Software
    • SMART Technology
    • Documentation
  • About
  • Contact
  • Home
  • Products
    • Logic+ Software
    • SMART Technology
    • Documentation
  • About
  • Contact

Getting Started

7
  • Getting Started
  • Timeline
  • Map Tools
  • Exclusion Zones
  • Workzones
  • Schedule Analysis
  • Alert Management

Analytics

4
  • Analytics
  • Data Health
  • Resource Metrics Table
  • Planned vs Actual

SMART Administration

4
  • Managing SMART
  • Project Settings
  • Device Management
  • User Management
  • Home
  • Docs
  • SMART
  • Analytics
  • Analytics
View Categories

Analytics

< 1 min read

SMART comes with a wide range of built-in analytics reports, allowing you to get the most out of SMART and manage your construction projects more efficiently.

We’re constantly working on new analytics solutions to make your life easier. Have some analytics work you need done? Get in touch with us at support@lwanalytics.com.

Accessing the Analytics View #

SMART Main Menu

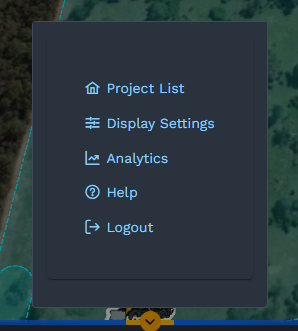
Open the Main Menu in SMART and select ‘Analytics’ to go to the Analytics Explorer.

Navigating Analytics #

Initial analytics explorer view

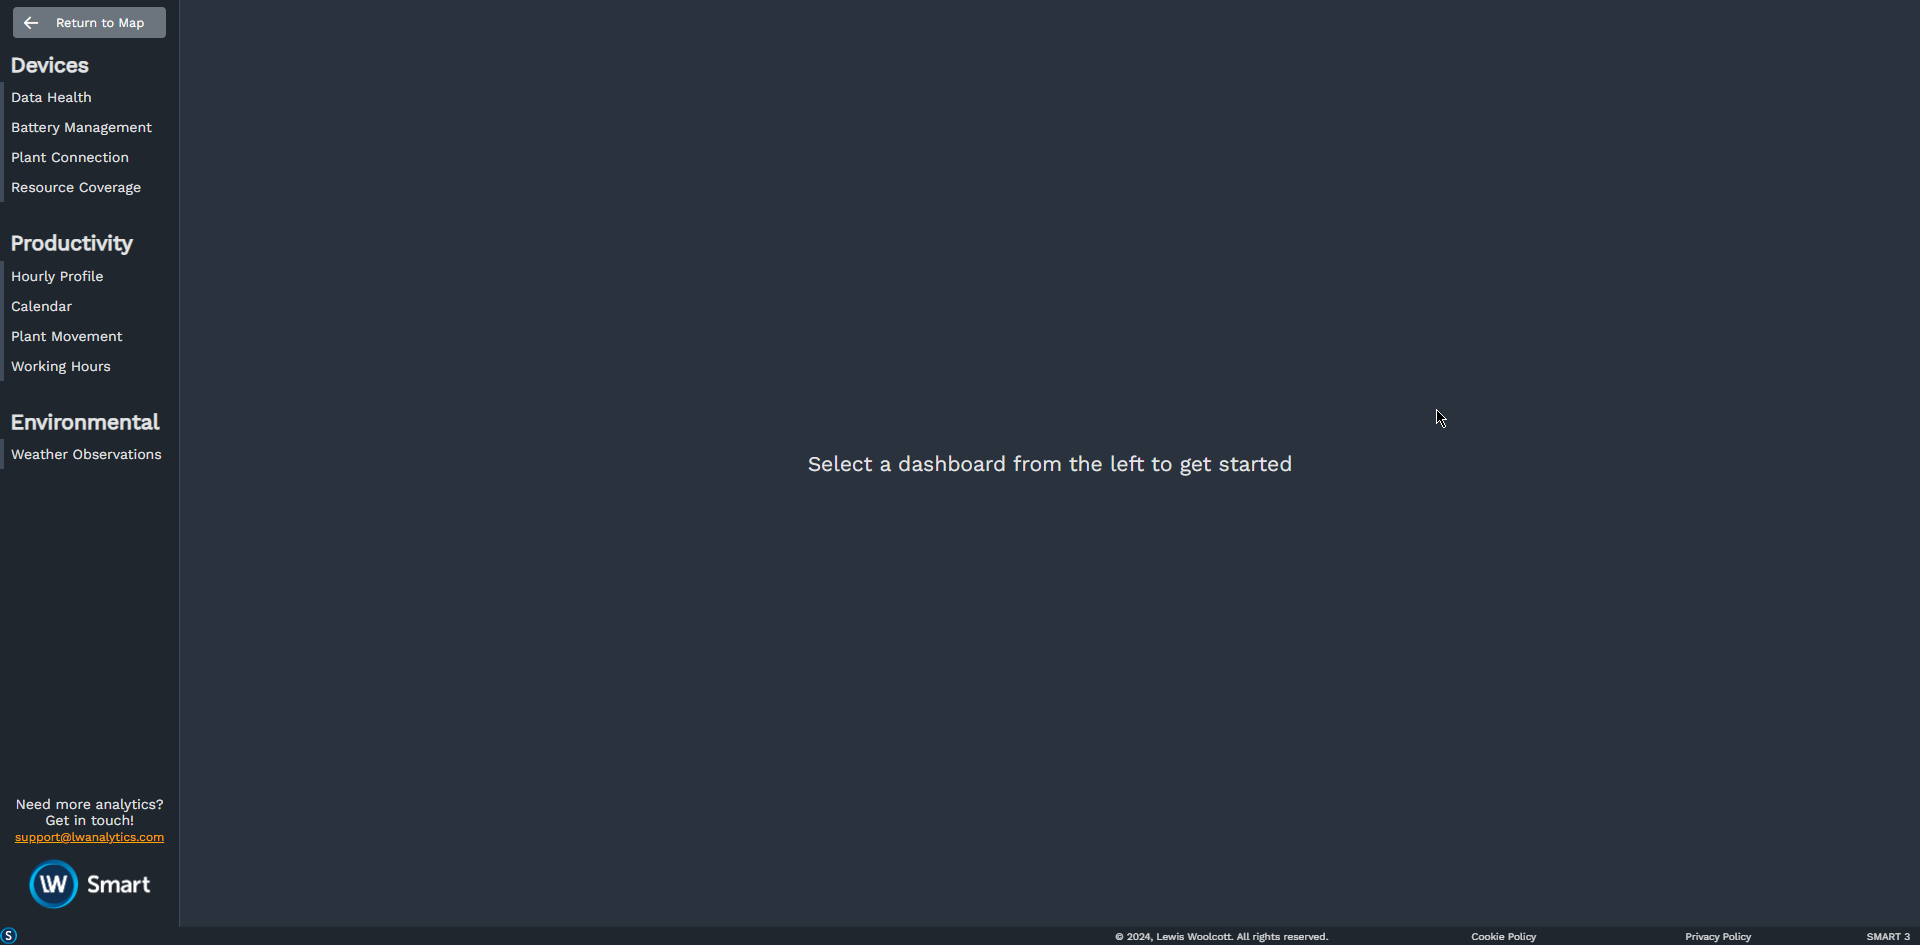
The SMART Analytics view consists of multiple independent dashboards. A list of all dashboards can be found on the left hand side of the analytics view. Click a tab in the sidebar to switch between different analytics dashboards.

If you want to return to the SMART Map view, click on the button at the top of the navigation sidebar.

Still stuck? How can we help?

How can we help?

Updated on July 4, 2025
Data Health
Table of Contents
  • Accessing the Analytics View
  • Navigating Analytics

Head Office

Level 7, 303 Coronation Drive
Milton QLD 4064 Australia

Home     |     Logic+     |     SMART     |     Documentation     |     Privacy Policy     |     Terms & Conditions

© 2025 LWARE Pty Ltd  |  Digital Marketing by Focused Marketing

  • Follow