SMART comes with powerful schedule analysis tools which allow you to compare planned tasks with actual resource activity.
Uploading a Schedule #
SMART supports XER files and MPP files. The first time you open the Gantt tab in SMART, you will be prompted to upload a new schedule.
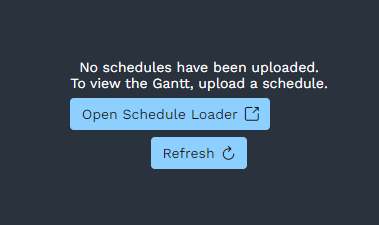
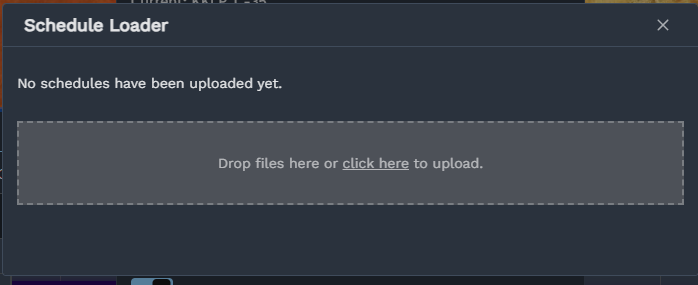
Click on the ‘Open Schedule Loader’ button to open the uploader. You can either drag and drop your schedule files onto the box, or click and navigate to the file in your file explorer.
Managing Schedule Versions #
To view a different version of the schedule, click on the gear icon in the top right of the Gantt chart. This will open up a dialog where you can choose between any schedules that have been uploaded to the SMART platform.
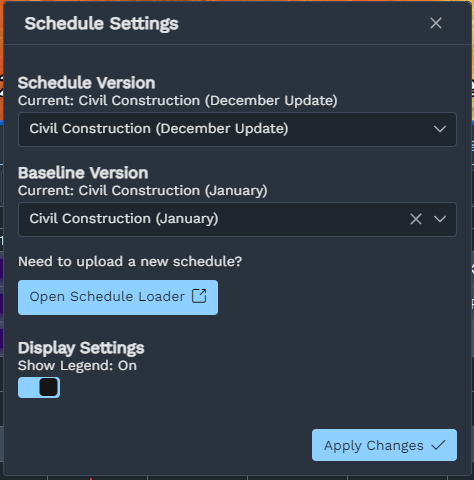
If you need to upload a new version, click on the ‘Open Schedule Loader’ button and repeat the above processs. Remember to upload all new schedule versions into the SMART platform!
Schedule Viewer #
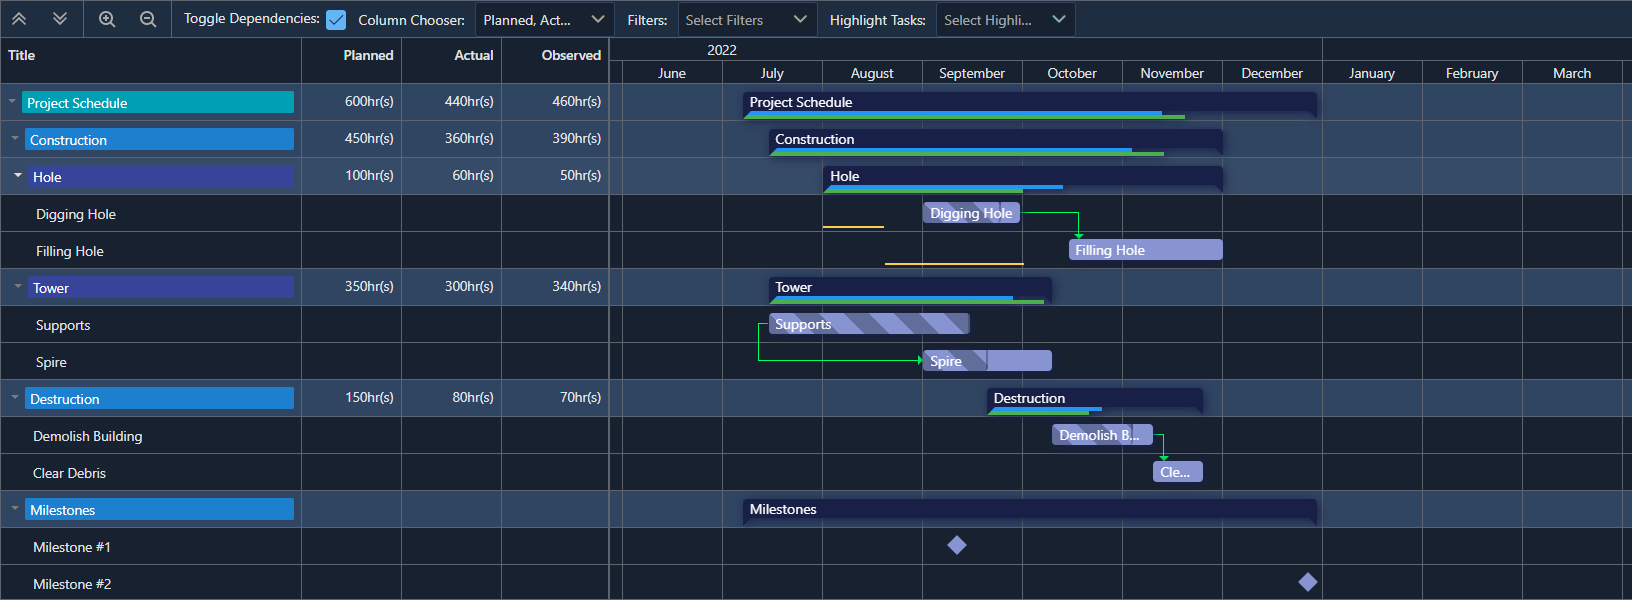
The Gantt chart in SMART has been designed to feel intuitive if you’ve used other project planning software in the past.
- Tasks are displayed as indigo bars.
- Baselines are displayed as thin yellow bars underneath.
- WBS levels are shown as dark coloured bars.
- Relationships are shown as green lines.
To move around the Gantt chart, click and drag within the Gantt space on the right-hand side. Use the mouse wheel to scroll up and down the table.
To zoom in, hold the CTRL key while scrolling. Alternatively, you can use the magnifying glass buttons in the top left corner.
Task Details #
For full information about a task, right click and select the ‘Task Details…’ option. This popup will display all fields associated with the task, including resourcing and user defined fields.
Zone Assignment #
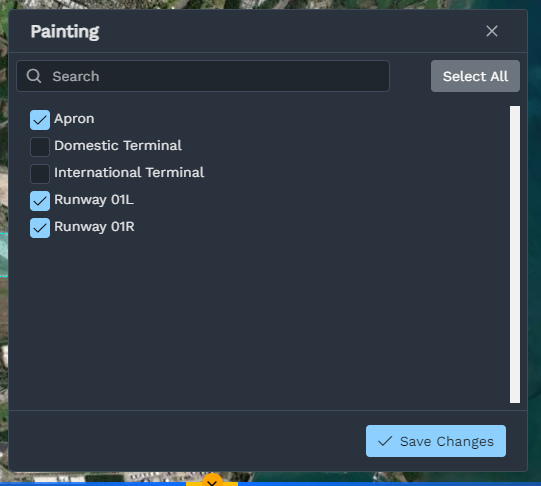
To assign a specific task to areas on the map, right click and select ‘Assign work areas’. Tick all areas that should be associated with this task, and select ‘Save Changes’.
If you need to assign many tasks to a zone at once, you can do this through the Workzone Table.
What areas should I assign to a task?
Any area where you expect a significant amount of time will be spent working on the task should be assigned.
For areas like stockpiles, if a significant amount of time is expected to be spent loading at a stockpile, it should be assigned to the task.
SMART can break down the data by zone type and provide reports on where time is being spent.
Filtering #
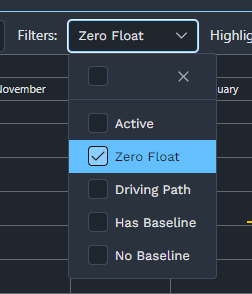
You can filter the Gantt to only look at certain tasks. For example, you might only want to show tasks that are currently taking place, or tasks that are on the critical path.
To apply filters, open the Filters dropdown on the top bar of the Gantt and tick the filters that you want.
The Gantt view is also linked to the Project Zone filters. If the map is filtered to a specific area, the Gantt chart will only display tasks associated with the selected area. This allows you to quickly produce a mini-Gantt for a specific area of the map.
<insert image/animation of filtering the schedule to a specific work area here>
Highlights #
Instead of filtering, you can alternatively highlight tasks that match a condition. Highlighted tasks will show up in a red colour instead of indigo.
Work areas assigned to highlighted tasks will be highlighted on the map. This allows you to locate areas on the map where work should currently be taking place, or keep an eye on locations that are on the critical path.
