Live Mode #
While in Live mode, resources on the map will automatically update to their most recent location as soon as data comes in. Resources which are not currently active will appear grayed-out at their last known location.
Live mode is locked to the current time. To explore resources in the past, switch to Historic View.
Historic Mode #
Historic View provides visibility of the historical location data of resources, and allows you to explore the project site as it was at any point in the past.
When viewing the timeline in Historic mode, a bar chart will be displayed indicated the relative activity during the time period.
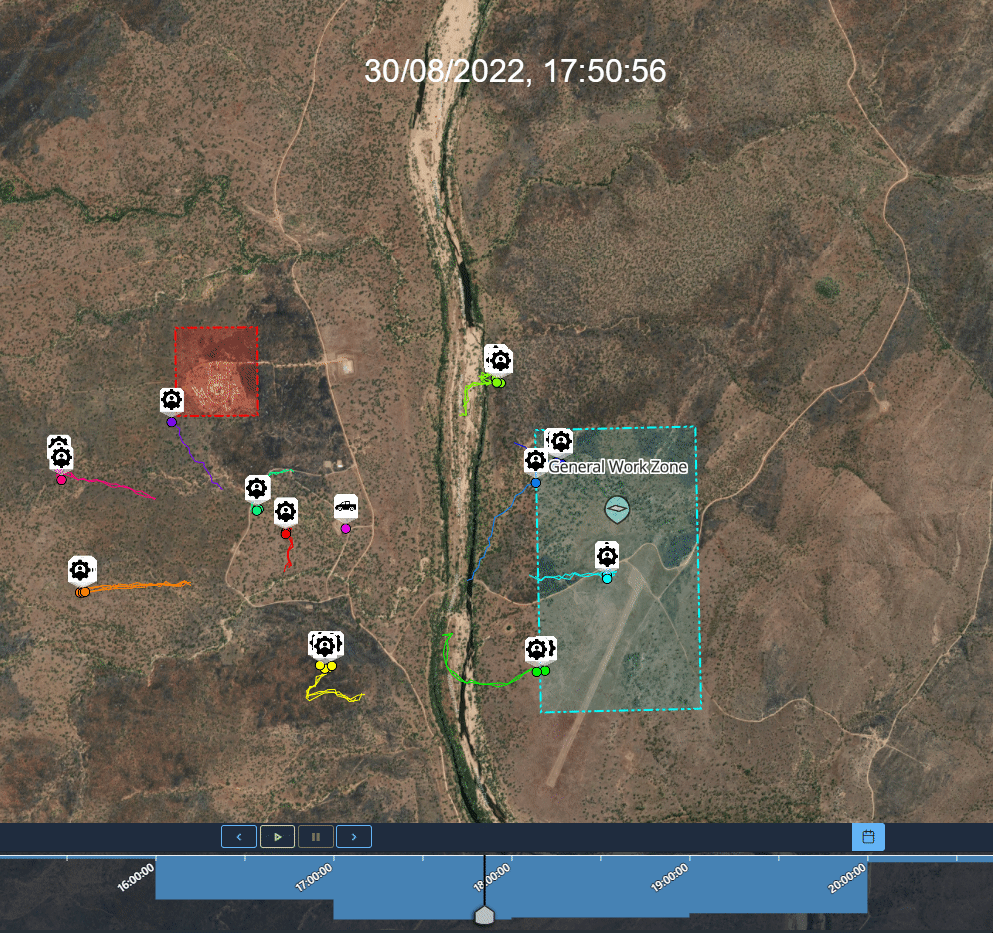
To view a different point in time, click and drag the cursor along the timeline. You can use the scroll wheel to zoom in and out on the timeline.
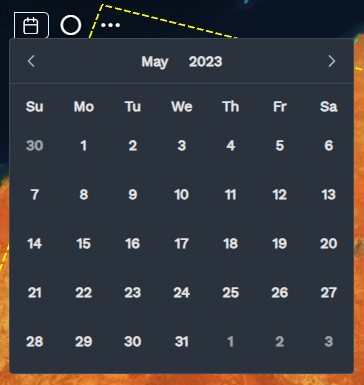
To jump to a different date click on the calendar icon in the top left and select the desired date.
To start animating through time, press the ▶ Play button. To stop the animation, press the ⏸ Pause button.
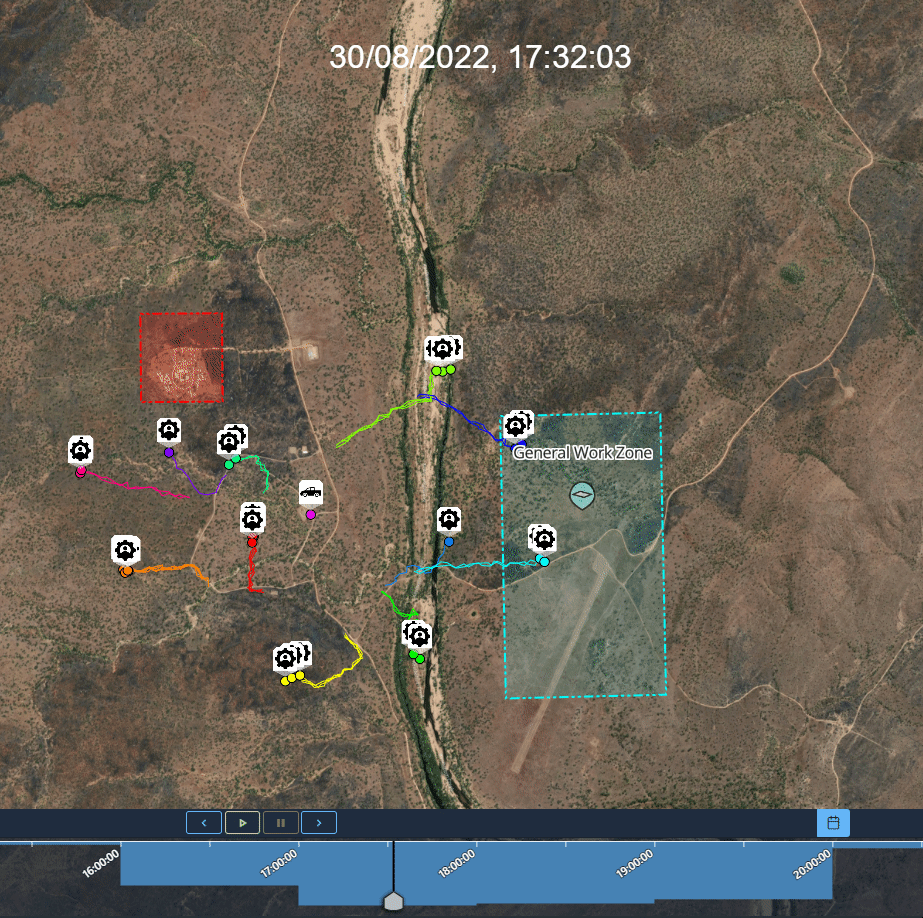
Window Mode #
Window View shows all locations covered by resources in a specified window period. In Window View, the points displayed on the map are based off all the data collected during the window selected on the timeline.
Window View is a powerful tool for assessing the past performance of projects. In Window View, you can visualise all past locations of resources to identify areas of high activity; or view animations tracking individual resources through time.
To adjust the time period of interest, simply click and drag either end of the window.
To view an animation of the resources, press the ▶ Play button. While animating in window mode, the timeline will be locked in place. The animation will only loop through the time period within the window.
While animation mode is active, you can press ⏸ Pause at any time. While the animation is paused, you can use the ⏴ and ⏵ buttons to step through frames one at a time. To exit animation mode, press the ⏹ Stop button and the window will be unlocked.
Playback Settings #
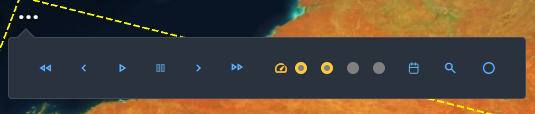
You can adjust the speed of the animation within the playback settings menu.
