Accessing SMART #
Project Select #
The SMART Portal can be accessed at www.smartcoro.com. You should bookmark this link to ensure quick access to the system.
Once logged in, you’ll be presented with the Project Selection screen. Here, you can choose between test and production environments.
- Active Projects: Display live tracking and data.
- Inactive Projects: Allow for reviewing historical data.
Click ‘Load’ to enter the selected project’s map view.
If you can’t see your project, click Show All Projects.
Interface Overview & Navigation #
The SMART Portal has two main areas (Map View and Details Panel) with related components:
- Map View (top portal panel): Interactive map that shows location tracking of people, plant, and zones
- Timeline: Shows the current time in Live mode and playback time in History mode
- TImeline Show/Hide: Used to show or hide the Timeline from the Map View
- Timeline Controls: Used to move from Live to History mode and includes playback tools (calendar selector, record playback, play/pause and speed)
- Map Legend: Colour legend for resources and zones
- Site Weather: Used to select weather station and show current weather
- Map Menu: Navigate to a location from GPS coordinates and access Map Tools, Layer Toggler, Map Settings and select Workzone Level.
- Map Mode: Move between Live to History modes and change map imagery
- Details Panel (bottom panel): Includes Main Menu and access to view and maintain project details
- Main Menu: Manage project setup, access analytics, change project, logout and user training
- Resources: View resource and plant information
- Zones: Manage Alert, Exclusion and Work Zones
- Schedule: View and load Project Schedule
- Safety: Manage Alert Rules, Contacts and action Alert Workflows
- Metrics Panel: Displays alert counts, device status, and system health

Navigating the Map View #
- Pan: Left-click + drag
- Zoom: Scroll mouse wheel
- Rotate/Tilt: Right-click + drag
- Reset orientation: Click the compass
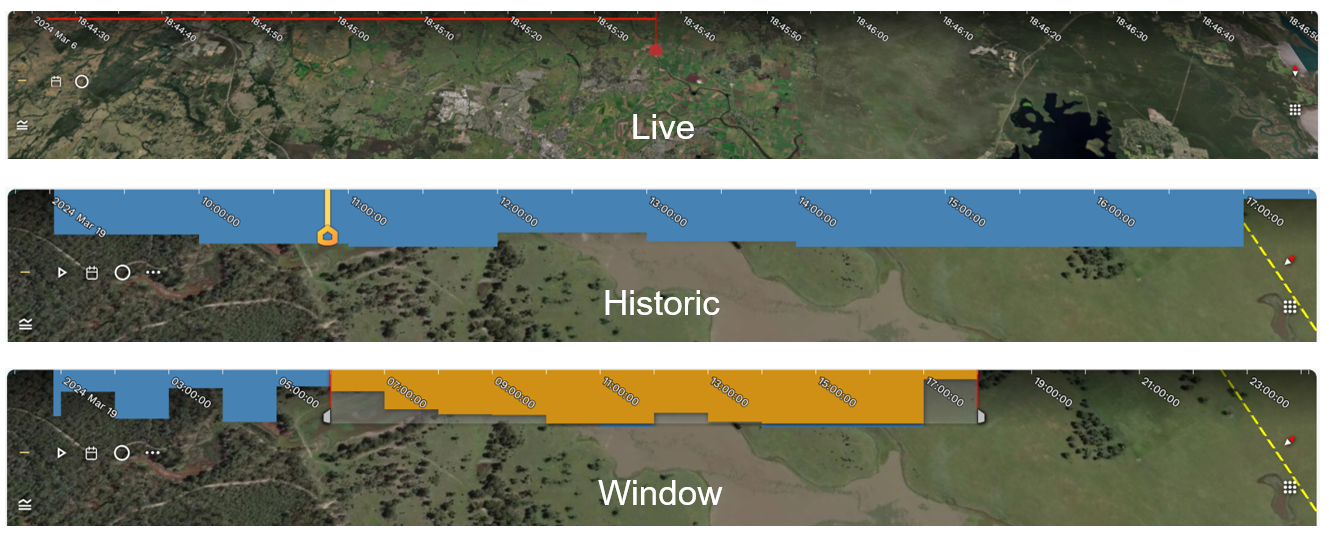
Map Mode #
- Live View: Current site activity
- Historic View: Review activity over time
- Window View: Visualise longer time periods
- Satellite / Map View Toggle: Switch between satellite imagery and standard map view
- Terrain / Flat View Toggle: Turn on/off 3D terrain overlay
Timeline #
The Timeline is situated at the top of the screen. In Historic and Window modes, you can drag the timeline to explore the site at any moment in time.
You can swap between the timeline modes at any time using the map mode selection icon.
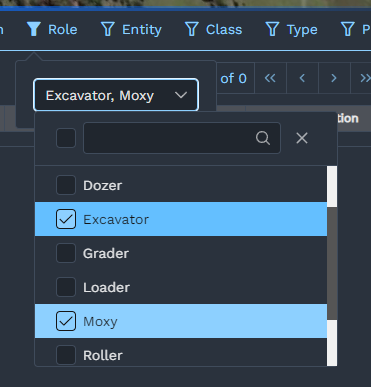
Filters #
You can filter resources on the map to only show what you’re interested in using the filters. On the right hand side of the table view, you can find the filter options. Click on a filter to open a dropdown and select what you’re interested in.
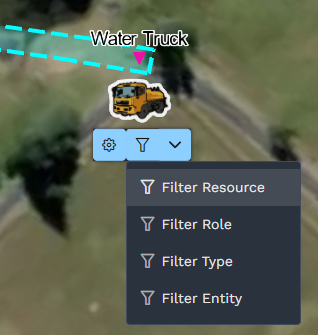
Alternatively, you can apply a filter by clicking a resource on the map and choosing the filter from there.
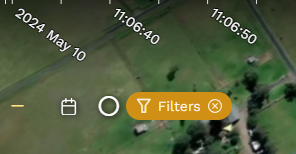
To quickly clear all filters, click on the ‘X’ next to the filters chip in the top left hand corner of the screen.
Display Settings #
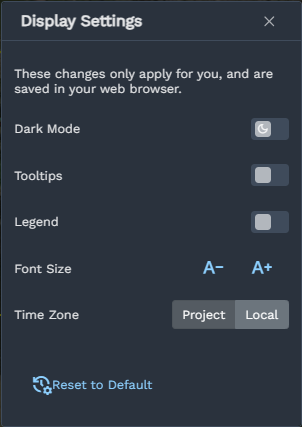
The display settings pane in the Main Menu has some helpful features to adjust the interface:
- Appearance: Switch between dark and light colour schemes for the interface
- Tooltips: Toggle tooltips when hovering over buttons
- Legend: Toggle to display the legend on the map
- Font Size: Adjust the size of text in the interface
- Time Zone: By default, SMART displays timestamps based on the project location. If preferred, you can show times based on your local timezone.
Analytics View #
The Analytics view in SMART provides a range of dashboards to gain a high-level overview of the project. This will be covered in-depth later in this guide.
Weather #
SMART includes real-time weather data. You can see the current weather conditions in the top right corner of the map view.
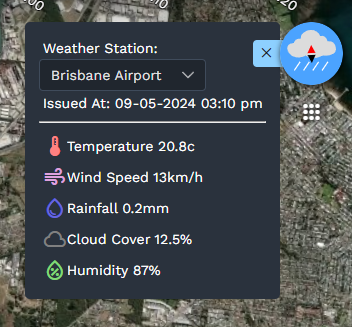
Click on the < in the blue tab to view more weather details.
