The Map Tools sidebar can be accessed by clicking on the ⋮⋮⋮ button in the top right of the map view. This sidebar includes some powerful ways to work with the map; and options to configure what is visible on screen.
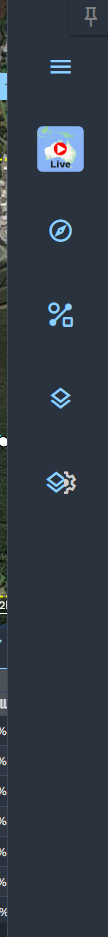
- Main Menu: Open the main menu
- Mode Selector: Choose between live, historic, and window views
- Navigation: Display longitude and latitude and precisely navigate the map
- Drawing Tools: Measure distance or area, and create work/exclusion zones
- Layer Toggle: Switch between visual presentations of restricted zones, project zones, and resources
- Layer Settings: Toggle labels and styles for map layers
Navigation #
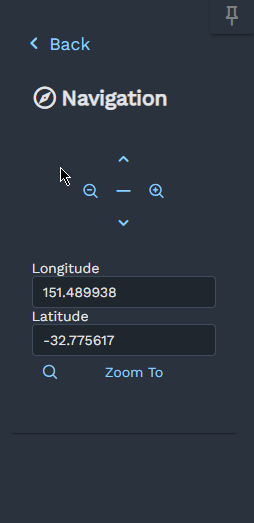
The Navigation pane allows you to precisely navigate the map. The current longitude and latitude is displayed.
To jump to a precise position, update the longitude and latitude fields and then press ‘Zoom To’.
Drawing Tools #
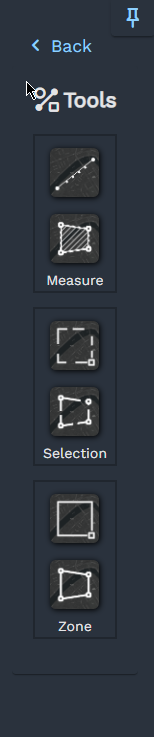
Drawing tools are divided into three sections: Measure, Selection, and Zone.
Measure #
These drawing tools allow you to measure distances or areas.
Selection #
These drawing tools allow you to mark out a temporary area of interest. SMART will then be filtered to only show data within that selection.
Zone #
These drawing tools allow you to easily create a new Work Zone or Exclusion Zone.
Layers #
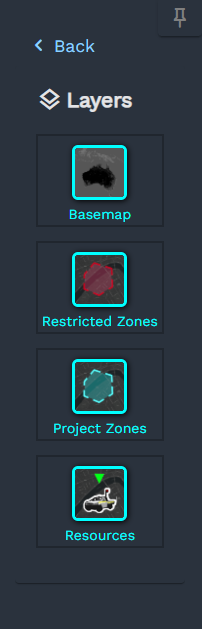
Each map layer can be turned on and off within the layers menu.
Layer Settings #
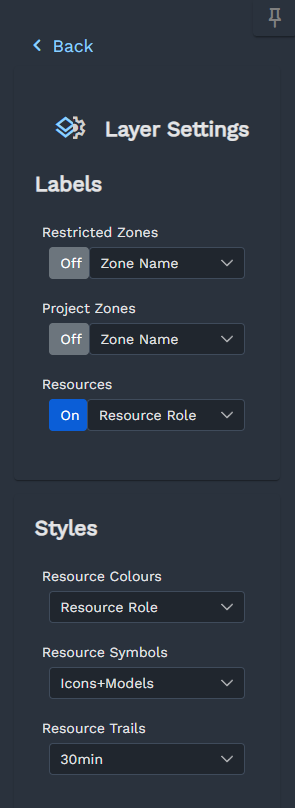
The Layer Settings menu allows you to customise how the map is displayed.
Labels #
Labels can be turned on and off for zones and resources. By default, resources are labelled with their role.
Resource Colours #
By default, each resource is assigned a colour based on their role.
Resource Symbols #
When zoomed out, SMART will display an icon for each resource. As you zoom further in, these icons are replaced with 3D models. These models help provide greater context when looking at you site. However, on lightweight devices they may be taxing. You can disable 3D models in this menu.
Resource Trails #
When a resource moves, SMART produces a coloured trail behind it. You can adjust the length of the trail from this menu.
